Keeping your eye on the ball: strategy, performance management and KPIs
Charities can generate so much data and information these days and also have access to other information outside of their own organisation. But, is all this data and information worthwhile and useful?
The celebrated management guru, Peter Drucker, once said; “What gets measured gets improved.” This may be true but only if we measure what is useful in the first place. At the end of the day, we need to assess whether, and how effectively, the organisation is achieving its key objectives; these may then be measured by KPIs (or Key Performance Indicators).
So: measure what matters.
Kick off: the right strategy
The Charity Governance Code emphasises the importance of strong and effective leadership by trustees, particularly in setting a charity’s strategy. The charity needs to be clear about its values, vision and mission — and then how it will achieve its mission. The strategy therefore drives the charity’s key objectives.
Charities are often clear on their mission but the difficulty comes in defining how to implement it and balancing ambition with the limited resources available eg whether to aim for quality of impact or quantity of output.
Keeping an eye on the right ball: Performance management
So, for charities, what information is useful? It is easy to focus on financial data as this is most readily available but the real success of charities should probably be measured in non-financial terms although these are often less visible and less quantifiable.
It is about measuring the critical success factors which link the strategy to impact and output, showing resources, activities and processes; the key questions are: what will success look like and how will it be measured?
Charities should identify milestones to ensure progress can be measured along the journey as realistic timeframes will help to set realistic and achievable goals. These will of course include financial goals but also the impact of the charity on its stakeholders: beneficiaries, society and its team.
The KPIs will lead to management actions: regular conversations with those responsible with a view to improving results. Such conversations compare actual with expected results not just for the charity as a whole but also for the individual and at the team level.
This practice will then drive new goals and appropriate action to enhance future performance.
Of course, as well as the difficulty of
measuring, it is also often difficult to assess cause and effect: was the
outcome really due to a particular action or were other factors playing a role?
Keeping an eye on the bouncing ball: Managing in uncertain times
Speed of change affects all organisations, charities included, and setting KPIs should not be regarded as a one off exercise: to be meaningful and helpful to decision-making they must be relevant to the specific circumstances of the time.
So, the charity needs to assess where it is now in its lifecycle: is it growing, in a steady state or at the cliff edge of decline? For newly formed charities, the KPIs may focus on growth metrics but in a steady state they will concentrate on indicators that help to prevent harm or to seize new opportunities.
When working at the cliff edge, the KPIs will focus on short term indicators, cash flow and helping to ease the impact of bad news. KPIs are important for risk management, whether financial, operational or in terms of reputation.
And for all of these it is not just about comparing actual with budget but it is about the trend over time. What is the trend telling us about the balance of our efforts and the real impact we are having over the years?
Keeping an eye on the whole ball: The KPIs
So, how do we bring all this together?
Too much information will cloud the view but equally a focus on one area will distort the overall picture and actions for the future.
One approach might be a dashboard or balanced scorecard, such as:
Financial
- Unrestricted reserves
- Bank balance
- Net surplus
- Income per donor
- % of admin to income
- Return on investments
Team
- Team turnover
- Number of volunteers
- Team sickness rate
- Team age profile
Community Engagement
- Number of donors
- Number of new partners
- % donor satisfaction
- Social media activity
Impact
- Number of beneficiaries
- % beneficiary satisfaction
- Number of requests
- Number of research papers
- Number of BAME beneficiaries
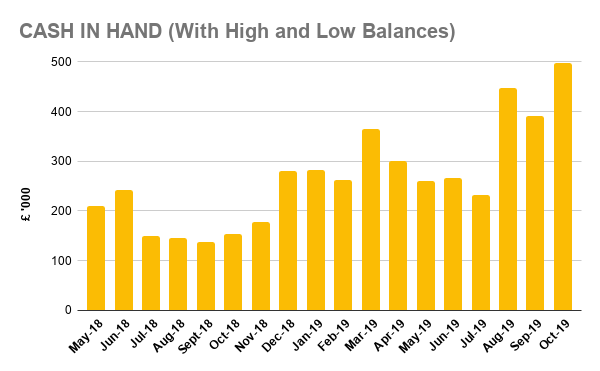
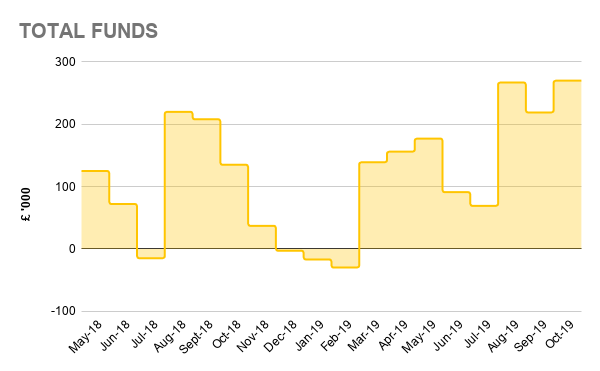
As with much information, the figures that these metrics generate will be more easily understood and the importance grasped if they are provided in a pictorial manner with graphs and charts.
The aim will be to have a balance of scores across the whole organisation with sufficient transparency that the whole team can see how successful they are.
A dashboard / balanced scorecard example
So, for a residential care home as an example, we might have the following structured report:
| XYZ Care Home Dashboard | This month | This month | This month | This YTD | This YTD | Last YTD | Comments |
| Actual | Budget | Last year | Actual | Budget | Actual | ||
| FINANCIAL | |||||||
| Average income per client | |||||||
| Extras charged | |||||||
| % of staff costs to income | |||||||
| Quick ratio | |||||||
| TEAM | |||||||
| Team turnover | |||||||
| % overtime rate | |||||||
| Team sickness rate | |||||||
| Vacancies | |||||||
| IMPACT | |||||||
| Occupancy rate | |||||||
| Average length of stay | |||||||
| % client satisfaction | |||||||
| % family satisfaction | |||||||
| COMMUNITY ENGAGEMENT | |||||||
| Number of enquiries | |||||||
| % referred by NHS trusts | |||||||
| Social media activity | |||||||
| % cold call enquiries |
With some accompanying graphs to help visualise the management information:

Keeping the ball in the air: what next?
To help trustees and management drive the organisation’s activities we can review the quantity and quality of the management information currently produced, and refine the content to help with strategy and decision-making.
If you have any questions or would like to speak to us about how we could help you, please contact Janice Matthews below:
Contact Our Experts